The $275 Billion Systematic Advantage
Annual subsidies flowing exclusively to hospital systems. Independent physicians receive $0.
Total Subsidies
$275.2B
annual, quantified pillars only
Revision
+120%
from original $125B estimate
Concentration
7.3%
of hospitals capture 50% of tax benefits
Independent Physicians
$0
received from any of these programs
The systematic advantages enjoyed by large health systems have more than doubled from our original 2025 estimate of $125+ billion to over $275 billion annually. This is not a static figure — it is accelerating. The 340B program alone grew 23% in one year. Medicaid supplemental payments are triple what we initially understood. New subsidy programs are being created. The $275+ billion moat is a growing, multi-layered extraction system that becomes more entrenched each year.
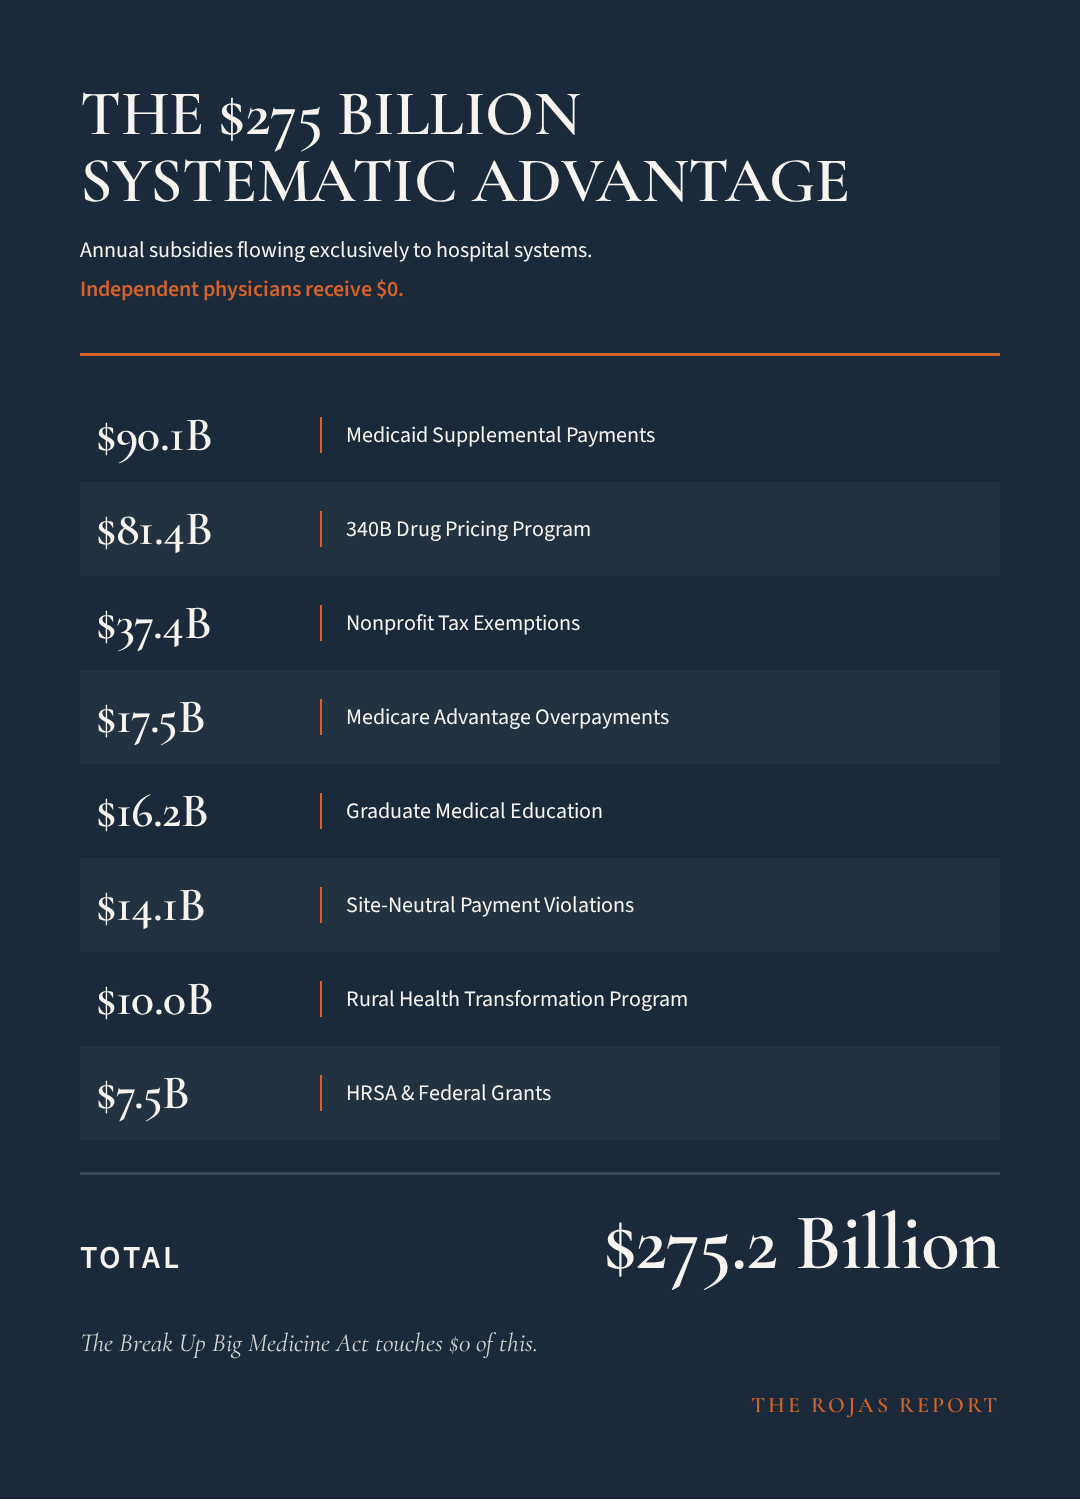
Eight Pillars. $275 Billion. Zero Accountability.
Each pillar is a distinct subsidy stream flowing exclusively to hospital systems. Independent physicians, ambulatory surgery centers, and private practices are excluded from every one.
Medicaid Supplemental Payments
DSH, UPL, and other complex payment mechanisms that funnel federal and state dollars exclusively to hospitals. Tripled from original $30B estimate when MACPAC published comprehensive data in December 2024.
340B Drug Pricing Program
Full Investigation →Hospitals purchase outpatient drugs at steep discounts, bill insurers at full price, and keep the spread. No federal requirement to pass savings to patients. Grew 23% year-over-year.
Nonprofit Tax Exemptions
Federal, state, and local tax exemptions. 55% comes from state and local levels. Just 7.3% of nonprofit hospitals (212 hospitals) capture 50% of all tax benefits.
Medicare Advantage Overpayments
Conservative estimate of the system-owned portion of $76B+ in total MA overpayments. Risk adjustment gaming, upcoding, and inflated star ratings.
Graduate Medical Education
Federal GME funding flows exclusively to teaching hospitals. Independent practices that train residents receive nothing. The pipeline is owned.
Site-Neutral Payment Violations
Hospitals charge facility fees for outpatient services identical to those provided in physician offices. Same service, same doctor, higher bill — because it says 'hospital' on the door.
Rural Health Transformation Program
New $50 billion program launched in 2025. $10B annually flowing to hospital systems. Did not exist in the original analysis.
HRSA & Federal Grants
Conservative estimate of hospital-directed federal grants. Includes HRSA programs, community health center grants redirected through hospital affiliations, and other federal funding streams.
Total Quantified Subsidies
$275.2 Billion
The Break Up Big Medicine Act touches $0 of this.
Independent physicians receive $0.
From $125B to $275B: What Changed
The systematic advantage didn't double because hospital subsidies grew. It doubled because we finally got the data. Better sources revealed the true scale of what was always there.
| Category | Original (2025) | Updated (2024-25) | Change | % |
|---|---|---|---|---|
| 340B Drug Pricing | $54.0B | $81.4B | +$27.4B | +51% |
| Medicaid Supplemental Payments | $30.0B | $90.1B | +$60.1B | +200% |
| Nonprofit Tax Exemptions | $37.4B | $37.4B | $0 | 0% |
| Graduate Medical Education | $18.0B | $16.2B | -$1.8B | -10% |
| Site-Neutral Payment Violations | — | $14.1B | +$14.1B | NEW |
| Medicare Advantage Overpayments | — | $17.5B | +$17.5B | NEW |
| Rural Health Transformation | — | $10.0B | +$10.0B | NEW |
| HRSA & Federal Grants | — | $7.5B | +$7.5B | NEW |
| TOTAL | $125B+ | $275.2B | +$150B | +120% |
Better Data Sources
- ›HRSA released official 2024 340B data (December 2024) showing the program hit $81.4 billion
- ›MACPAC published comprehensive supplemental payment data (December 2024) revealing the full $90.1B scale
- ›Johns Hopkins Bloomberg School study (September 2024) provided rigorous methodology for tax exemption estimates
- ›MedPAC and GAO reports quantified MA overpayments and site-neutral payment impacts
Conservative Methodology
- ›Uses 2021 tax exemption data ($37.4B) rather than estimating 2024 figures (likely $40B+)
- ›Takes midpoint or lower end of ranges for MA overpayments and federal grants
- ›Estimates only system-owned portion of MA overpayments (not full $76B)
- ›Excludes numerous unquantifiable advantages despite their significant impact
Five Things the Data Reveals
The 340B Explosion
The 340B program grew from $54B to $81.4B — an increase of $27.4 billion in just a few years. This single program now exceeds the entire original estimate of systematic advantages. The 23% year-over-year growth rate suggests this will continue to expand rapidly. At this pace, 340B alone will surpass $100B by 2027.
The Hidden Giant
Medicaid supplemental payments tripled from $30B to $90.1B. This wasn't growth — it was better data revealing the true scale of DSH, UPL, and other complex payment mechanisms.
Four New Categories
Site-neutral violations, MA overpayments, Rural Health Transformation, and HRSA grants add $46.6–$54.1 billion. These were either not quantified or didn't exist in the original analysis.
Extreme Concentration
Just 7.3% of nonprofit hospitals (212 hospitals) capture 50% of all tax benefits. A small number of mega-systems are the primary beneficiaries of the systematic advantage.
State & Local Dominance
55% of tax exemptions come from state and local levels, not federal. The subsidy structure requires coordination across multiple levels of government to reform — which is exactly why it persists.
The Unquantified Moat
The $275 billion is the floor. These structural advantages are real, documented, and significant — but resist precise national quantification. They make the moat wider, deeper, and harder to breach.
Tax-Free Bond Financing
Approximately 6.4% tax benefit per the Lown Institute. Hospitals issue tax-exempt municipal bonds at rates unavailable to any private practice or for-profit competitor.
System-Owned Health Plans
Revenue capture mechanism. When the hospital owns the insurance plan, the premium dollar never leaves the system. Both sides of the transaction, one beneficiary.
Physician-Owned Hospital Ban (Section 6001)
The ACA banned new physician-owned hospitals and froze expansion of existing ones. The competitive pathway was eliminated by statute.
Certificate of Need Laws
35 states and DC require government permission to build, expand, or add services. Incumbents sit on the boards that approve competitors. The regulatory moat.
Lobbying & Regulatory Capture
Hospital systems are among the largest lobbying spenders at both federal and state levels. Former executives rotate into regulatory roles. The rules are written by the regulated.
Local Hospital District Levies
Property tax-funded subsidies that flow directly to hospital districts. Varies by locality but adds billions in aggregate. Not quantified at the national level.
Commercial Rate Cost-Shifting
Charity care and bad debt costs are shifted to commercial payers through higher negotiated rates. The subsidy is invisible — it's built into every insurance premium.
Health System Dossiers
Individual investigations into the systems that benefit most from the $275 billion systematic advantage. Each dossier examines tax status, financial scale, executive compensation, market dominance, and community benefit.
Methodology & Data Sources
Original Estimate Sources (2025)
- Based on 2023-2024 data available in early 2025
- Relied on partial data and estimates for several categories
- Focused on four main pillars: 340B, tax exemptions, Medicaid payments, GME
Updated Estimate Sources (2024-2026)
- HRSA official 340B data (December 2024)
- MACPAC supplemental payment data (December 2024)
- Johns Hopkins JAMA study on tax exemptions (September 2024)
- MedPAC Medicare Advantage analysis (January 2026)
- GAO site-neutral payment estimates
- CMS Rural Health Transformation Program data (December 2025)
- HRSA Grants Dashboard (2025-2026)
The Rojas Report Take
The systematic advantage is not just large — it's accelerating. The 340B program alone grew 23% in one year. Medicaid supplemental payments are triple what we initially understood. New subsidy programs are being created. The Rural Health Transformation Program didn't exist when we published the original estimate.
Independent practices face an even steeper uphill battle than previously documented. The $275+ billion moat is not a static figure — it's a growing, multi-layered extraction system that becomes more entrenched each year.
Consider the behavioral economics of this structure. Every dollar of subsidy creates a constituency that will fight to preserve it. $275 billion buys a lot of lobbyists, a lot of board seats, a lot of campaign contributions, and a lot of regulatory capture. The system doesn't just benefit from the money — it uses the money to ensure the money keeps flowing.
The Break Up Big Medicine Act targets insurer-PBM-physician ownership and vertical integration between payers and prescribers. It touches $0 of the $275 billion annual hospital subsidy apparatus. It ignores CON laws in 35 jurisdictions. It ignores the physician-owned hospital ban. It ignores $37.4 billion in nonprofit hospital tax exemptions.
This isn't market success. It's regulatory arbitrage on a scale that dwarfs even our initial estimates.
Continue Reading
Explore the individual subsidy pillars and state-level investigations.